Index Portfolio
Portfolio Statistics
| Year | January | February | March | April | May | June | July | August | September | October | November | December | Portfolio total |
|---|---|---|---|---|---|---|---|---|---|---|---|---|---|
| 2024 | 0.88% | 1.87% | 0.58% | -1.63% | - | - | - | - | - | - | - | - | 1.67% |
| 2023 | -4.03% | -5.08% | 0.87% | 4.12% | -7.31% | 4.31% | 3.18% | -2.64% | -1.47% | -7.07% | 2.79% | 2.27% | -10.55% |
| 2022 | Only available to supporters | ||||||||||||
| 2021 | Only available to supporters | ||||||||||||
| 2020 | Only available to supporters | ||||||||||||
| 2019 | Only available to supporters | ||||||||||||
| 2018 | Only available to supporters | ||||||||||||
| 2017 | Only available to supporters | ||||||||||||
| 2016 | Only available to supporters | ||||||||||||
| 2015 | Only available to supporters | ||||||||||||
| 2014 | Only available to supporters | ||||||||||||
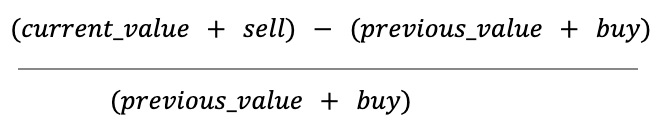
It's calculated as monthly capital gain without buy/sell transactions of the month.
Dividends are not included.
Calculated as: