DividendsWork.com
DividendsWork.com portfolio. This portfolio is connected to Interactive Brokers and is automatically updated whenever a transaction is made, with a 1-day delay.
Portfolio Statistics
| Year | January | February | March | April | May | June | July | August | September | October | November | December | Portfolio total |
|---|---|---|---|---|---|---|---|---|---|---|---|---|---|
| 2026 | -0.01% | -1.36% | -5.45% | 7.50% | 1.38% | -3.53% | - | - | - | - | - | - | -1.96% |
| 2025 | 3.72% | 0.17% | -4.38% | 0.07% | 5.74% | 3.77% | 1.28% | 3.16% | 1.82% | 0.60% | -1.60% | -0.56% | 14.24% |
| 2024 | Only available to paid members | ||||||||||||
| 2023 | Only available to paid members | ||||||||||||
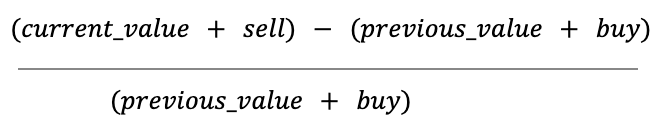
It's calculated as monthly capital gain without buy/sell transactions of the month.
Dividends are not included.
Calculated as: