Growth Portfolio
Picking up stocks that are innovative, should have higher revenue in 10 years and grow.
Portfolio Statistics
| Year | January | February | March | April | May | June | July | August | September | October | November | December | Portfolio total |
|---|---|---|---|---|---|---|---|---|---|---|---|---|---|
| 2026 | 1.92% | -3.16% | 1.89% | 4.38% | 17.22% | -6.73% | - | - | - | - | - | - | 14.75% |
| 2025 | 8.38% | -5.52% | -9.18% | 4.65% | 14.99% | 5.87% | 3.72% | 4.91% | 9.11% | 3.83% | -5.24% | -3.33% | 33.78% |
| 2024 | Only available to paid members | ||||||||||||
| 2023 | Only available to paid members | ||||||||||||
| 2022 | Only available to paid members | ||||||||||||
| 2021 | Only available to paid members | ||||||||||||
| 2020 | Only available to paid members | ||||||||||||
| 2019 | Only available to paid members | ||||||||||||
| 2018 | Only available to paid members | ||||||||||||
| 2017 | Only available to paid members | ||||||||||||
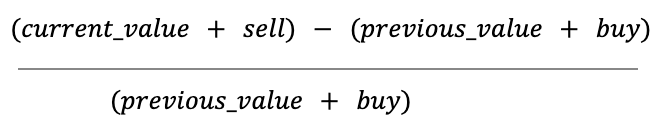
It's calculated as monthly capital gain without buy/sell transactions of the month.
Dividends are not included.
Calculated as: