fio + t212 USD
Portfolio Statistics
| Year | January | February | March | April | May | June | July | August | September | October | November | December | Portfolio total |
|---|---|---|---|---|---|---|---|---|---|---|---|---|---|
| 2026 | -0.29% | -6.40% | -2.03% | 6.29% | 1.49% | -1.42% | -2.16% | - | - | - | - | - | -4.88% |
| 2025 | 1.09% | -3.16% | -2.09% | 1.28% | 4.67% | 2.55% | 1.57% | -1.70% | 1.93% | -0.87% | -4.48% | -1.73% | -1.33% |
| 2024 | Only available to paid members | ||||||||||||
| 2023 | Only available to paid members | ||||||||||||
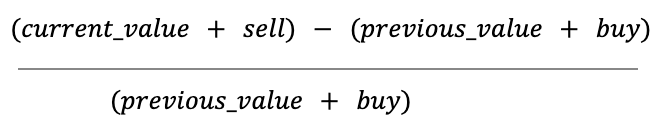
It's calculated as monthly capital gain without buy/sell transactions of the month.
Dividends are not included.
Calculated as: